Knowledge Base
How to Use Pivot Tables in Google Sheets?
Akash Kumar
2 min readPublished on Date | Last updated on Date
Google Sheets and other spreadsheet software offer exceptional analysis capabilities, however, some people feel these software lack an extra layer of insight. It can be tough to summarize or draw conclusions from a basic tabular spreadsheet view when there is massive amount of data.
The solution to this issue is pivot table. While many Excel users often use pivot tables, Google Sheets also offer the same functionality.
What Are Pivot Tables?
When data is small, it can be simple enough to read through and understand the numbers. But as your spreadsheet begins to grow, drawing conclusions requires a bit more power. That's where pivot tables come in. A pivot table takes a large set of data and summarizes it.
Normal spreadsheets essentially have data represented by two axes, horizontal (columns) and vertical (rows):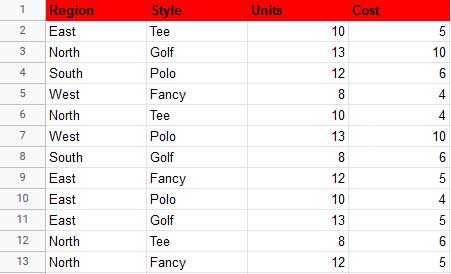
To derive more insights, you'll need to add data on another level. In the case above, for example, you start with each sale as its own row, and each column offers different information about that sale. But if you pivot the axes of the table, you can add another dimension to your analysis.
How to Use Pivot Tables in Google Sheets?
Google Sheets pivot tables are as easy to use as they are powerful. Here's a quick look at how you can use them:
Step 1 : Open a Google Sheets spreadsheet, and select all of the cells containing data
Step 2 : Click Data & Pivot Table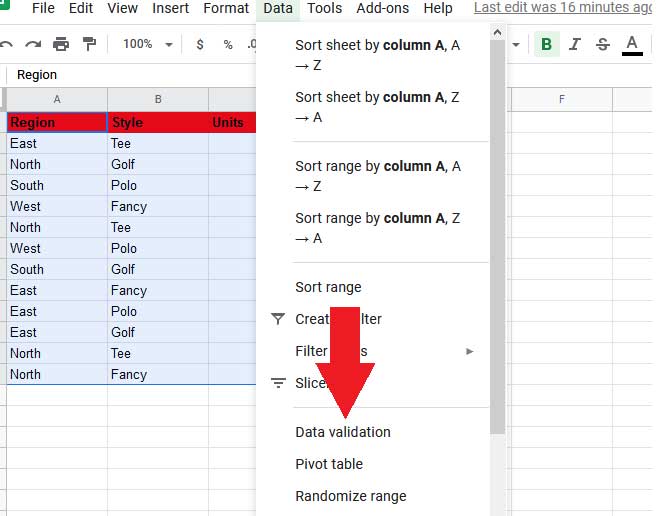
Step 3 : Check if Google's suggested pivot table analyses answer your queries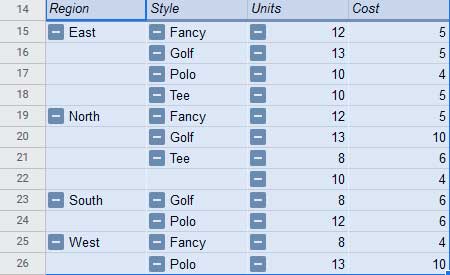
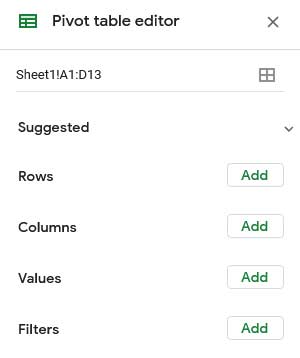
From the pivot table editor, you can:
- Create a customized pivot table, click Add next to Rows and Columns to select the data you'd like to analyze.
- Click Add next to Values to select the values you want to display within the rows and columns.
- Click Filters to display only values meeting certain criteria.
Once you have put all the data in one place, you need to analyze it and now you can do that efficiently using pivot tables. With pivot tables in Google Sheets, you can unlock the potential of your data and distill the information for all stakeholders without using complicated formulas.
Appy Pie Connect help you get all of your company's data into Google Sheets with 150+ app integrations.
loading...
Related Articles
- How to setup Login with Facebook in my Facebook Developer Account
- How can I setup PayPal web hooks using the PayPal Developer Portal
- How Can I Set Up Facebook Page Integrations With Appy Pie Connect?
- How Can I Set Up Facebook Messenger Integrations With Appy Pie Connect?
- How Can I Set Up Facebook Integrations With Appy Pie Connect?
- How Can I Set Up ClickUp Integrations With Appy Pie Connect?
- How Can I Set Up GitLab Integrations With Appy Pie Connect?
- How Can I Set Up Strava Integrations With Appy Pie Connect?
- How Can I Set Up RepairShopr Integrations With Appy Pie Connect?
Still can’t find an answer?
Send us a ticket and we will get back to you.